Debugging ejabberd
This took me a little while to work out, and will probably be useful in the future so I thought I’d make a post about it and use my blog for the first time in a year and a half ;)
-
Download the ejabberd source:
git clone https://github.com/processone/ejabberd.git
-
Configure (I want ODBC support, but you might not need it)
cd ejabberd && ./configure --enable-odbc
-
Compile code with debugging enabled
make debug=true
-
Install ejabberd; I couldn’t work out if there was a way to run ejabberd without installing it.
sudo make install
-
Configure ejabberd as required by editing /etc/ejabberd/ejabberd.cfg. Then run it with
sudo ejabberdctl start
-
Attach to the running erlang process
sudo ejabberdctl debug
-
Press any key to continue. Then in the shell type:
im().
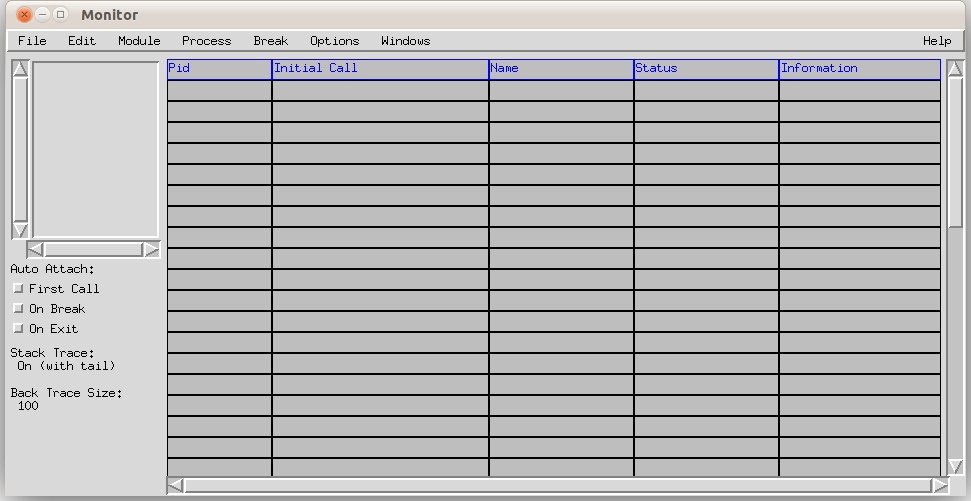
This will open up the lovely erlang debugger monitor window, as shown below.

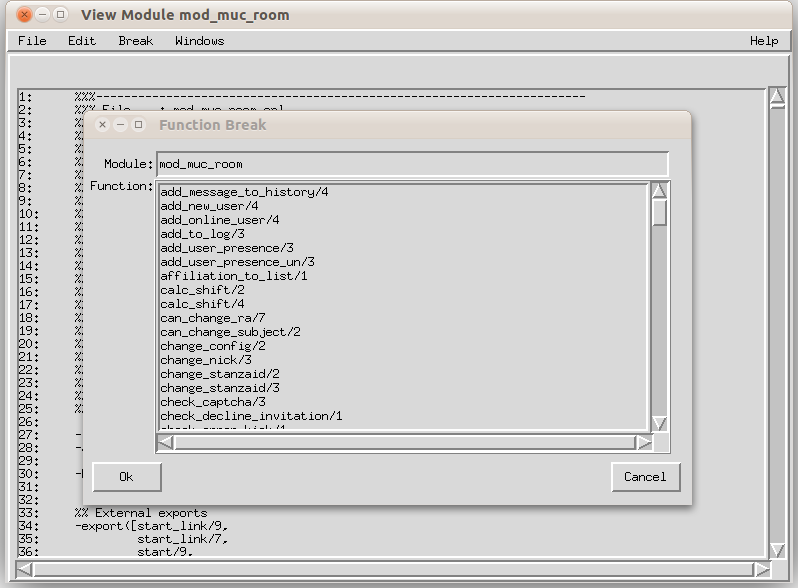
Then go to Module -> Interpret and browse to the ejabberd source code folder from earlier, and choose the .erl file you want to debug. This only works if the beam files have been compiled with debugging enabled, using the make step from before. Once you’ve selected a file, it will appear in the list on the left and you can double click it to view it and add break points as shown below.

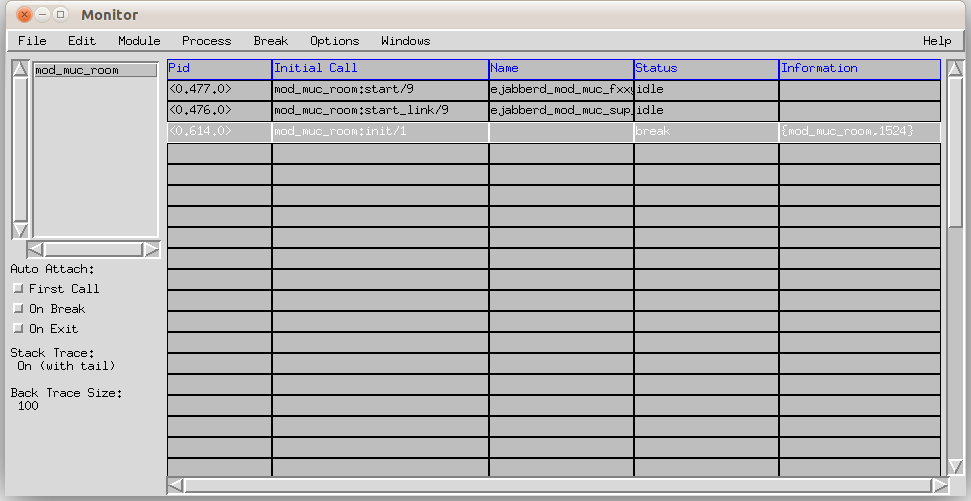
To trigger the break point you just need to join a chat room with a client:
[caption id=”attachment_216” align=”aligncenter” width=”583” caption=”Break point triggered”] [/caption]
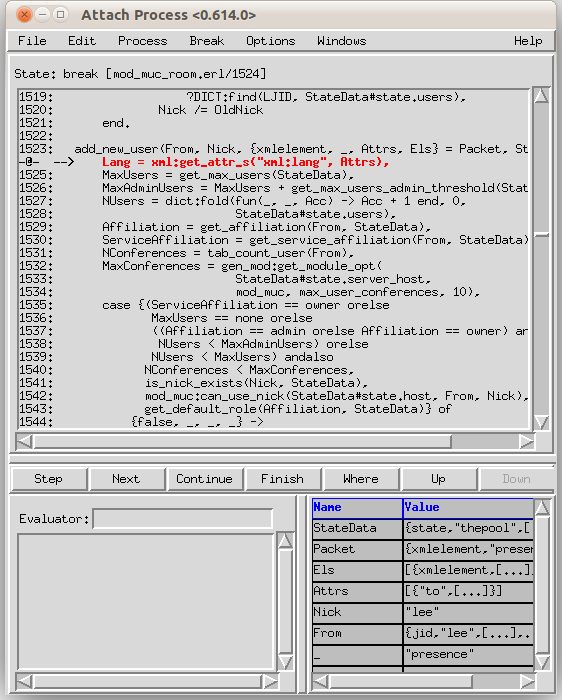
You can then step through the code by double clicking on the line with the break in it:
[caption id=”attachment_217” align=”aligncenter” width=”337” caption=”Step through debugging”] [/caption]
Happy debugging!